
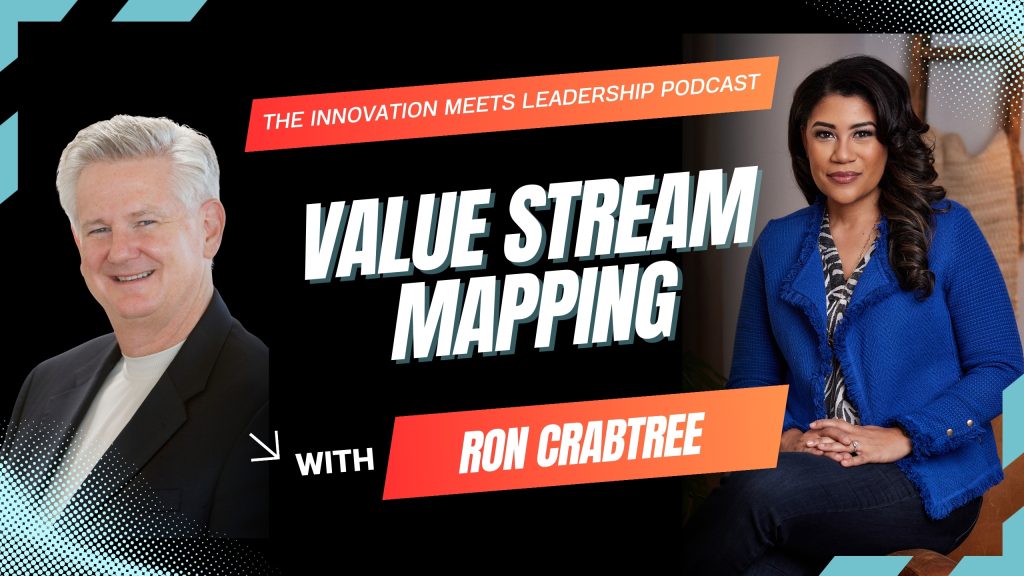
When leaders talk about improving performance, the conversation often jumps straight to solutions like new software, automation, org changes, or “doing more with less.” In a recent episode of the Innovation Meets Leadership Podcast, Ron Crabtree joins hostto unpack a more foundational step: value stream mapping, a practical, visual way to understand how work actually gets done end-to-end and where the real leverage points are.
Ron frames the conversation with a reminder that if you cannot describe what you are doing as a process, you do not truly know what you are doing. Value stream mapping is the method that makes the process visible, and while many people think of it as a manufacturing tool, the core idea applies across industries because every organization delivers value through a chain of actions, handoffs, delays, and decisions.
Start with the Mission
One of the strongest takeaways from Ron’s approach is that value stream mapping is not “one template fits all.” There are countless ways to map a process, and the right method depends on your mission. Before choosing what to map or how detailed to get, leaders need a clear answer to a simple question: What are we solving for?
Ron walks through how manufacturing has traditionally answered this using Toyota’s well-known performance priorities: Safety, Quality, Delivery, Cost, Productivity, and Morale (SQDCMP). In this context, mapping helps teams understand tradeoffs and target improvements across the measures that matter most. Outside of manufacturing, the mission might look different. Many organizations map processes to reduce turnaround time, improve quality, cut costs, elevate customer experience, or determine where digitization and AI will have the highest return.
Where Digitization and AI Actually Fit
A theme throughout the episode is that value stream mapping helps leaders avoid random acts of automation. If you have 100 things you could digitize, mapping helps you identify the few that will actually move outcomes, including speed, quality, cost, and experience.
Natalie shares an example from a historical site where they mapped the customer journey from entry to exit, marking moments of delight, disappointment, and “meh.” This same thinking, Ron notes, applies anywhere. Whether you are running a contact center, managing HR workflows, or leading engineering change processes, mapping surfaces where friction lives and where investment will pay off.
The Right Level of Detail
Not every process needs extreme precision. Ron suggests the level of granularity should be driven by risk and the consequences of making a wrong decision. In high-risk environments, like aircraft systems, for example, the standard may need to approach Six Sigma level rigor. In most business processes, leaders can often make strong decisions with directionally accurate data, for which Ron cites a common target of roughly 80-85% confidence. This level of accuracy is often enough to run a Pareto analysis, uncover the small number of steps causing the majority of delay, and focus improvement efforts where they matter most.
Practical Starting Point
For organizations new to value stream mapping, start by picking one core end-to-end process that defines how you deliver value and “walk it” as a customer would. Ron suggests starting with high-level functional handoffs and visualizing the work using a swim lane chart (one lane per functioning role). Then capture basic reality-based data like how long steps take, where work sits in inboxes, and how often things come back because they were not done right the first time.
Case Study: 17 Steps to 0
One of the most striking moments from the episode is Ron’s university example. A large institution was taking weeks to set up new employee email accounts. After mapping the process, they discovered 17 steps driven by approvals, mail handoffs, and unnecessary complexity. The improvement exercise first pushed the group toward three or four steps, and then someone reframed it to say the ideal future state was zero steps. In this case, access could be pre-defined by role and automated.
This demonstrates the power of mapping. Once the process is visible, inefficiencies stop being abstract and start becoming obvious, solvable design problems.
Efficiency and Innovation Work Best Together
Natalie closes by highlighting that some organizations chase efficiency so hard they forget innovation, while others chase innovation and ignore the inefficiencies draining momentum. Ron’s point is that value stream mapping supports both. It creates clarity leaders need to improve today's performance while also making smarter decisions about automation, digitization, and AI.
Listen to the full episode of The Innovation Meets Leadership Podcast to learn more. For additional expertise and insights, connect with Ron on LinkedIn or visit MetaExperts.com.